Devpost
Participate in our public hackathons
Devpost for Teams
Access your company's private hackathons
Grow your developer ecosystem and promote your platform
Drive innovation, collaboration, and retention within your organization
By use case
Blog
Insights into hackathon planning and participation
Customer stories
Inspiration from peers and other industry leaders
Planning guides
Best practices for planning online and in-person hackathons
Webinars & events
Upcoming events and on-demand recordings
Help desk
Common questions and support documentation
The $10,000 recurring Tableau product gap solved.
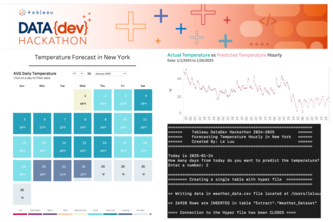
Apply Tableau APIs and Machine Learning to predict the temperature data and build Tableau dashboard.
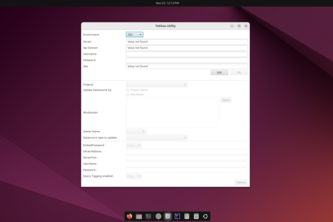
GUI based Tableau Utility to update data source properties. This work reduces the manual efforts of update properties for each data source present in a workbook, given multiple workbooks in a project.
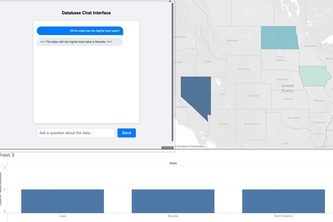
Empower your analytics with AI-driven queries. Pull only the data you need from your dashboard—for deeper, self-service insights
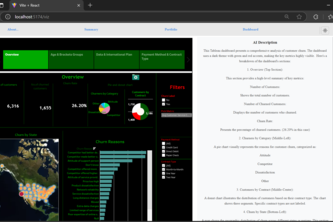
Empowering communities with data-driven contract clarity.
Embed, capture, and analyze Tableau visualizations with AI in a seamless React app
This project revolutionizes Tableau with with improved parameter control—instantly adjust data using a dynamically updating chart and slider, enabling seamless, and visually compelling presentations.
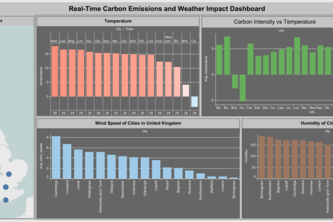
Tracking Emissions, Shaping Tomorrow's Climate.
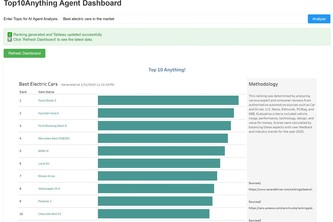
AI Agent Powered Ranking Insights with Tableau
Promising immediate value
ClearView: Simplifying Life with a Dyslexia-Friendly Reader, Smart Calendar, and Supportive Chatbot
Unveiling CO₂ Emissions for Smarter Climate Solutions
Leverage data analytics to optimize fleet performance, reduce costs, and enhance safety through real-time insights into truck availability, fuel efficiency, and driver behavior.
Financial Flexibility For All
-
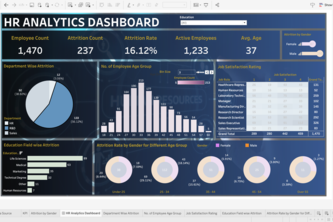
Empower decisions with HR data analytics! Uncover attrition drivers, predict trends, and implement strategies to retain top talent effectively.
"Molding Tomorrow’s Market: Where Innovation Meets Investment!"
"An interactive e-commerce dashboard built with Tableau, visualizing product distribution, pricing trends, and more using data from the Fake Store API and Python processing."
1 – 19 of 19